
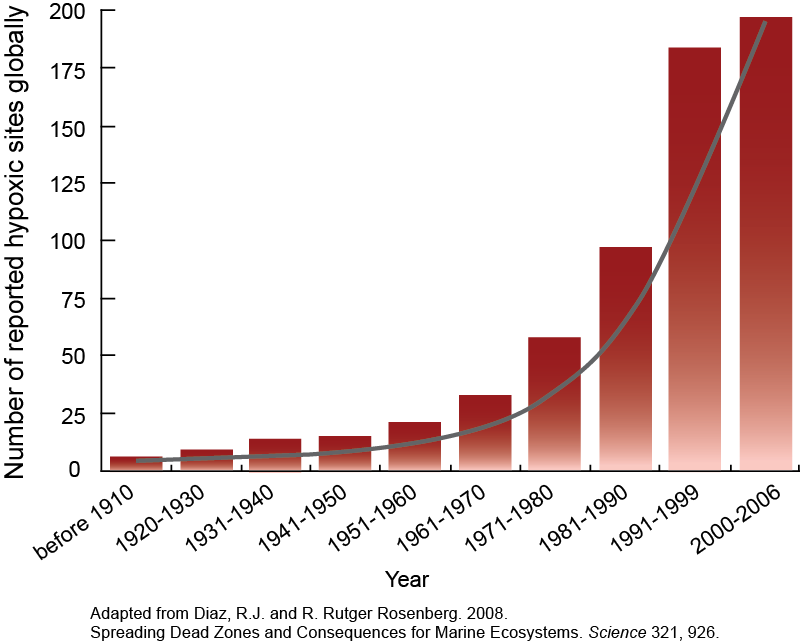
We all live in a changing world. Significant changes are occurring in our natural- and human-dominated environments at a range of scales from short to long and small to large. Changes in environmental conditions that occur over many years and across many regions are considered large trends.One such trend is the general increase in the frequency of occurrences and the physical dimensions of coastal dead zones worldwide. It appears that this trend of globally expanding dead zones is related both to increasing nutrient discharge from the land into adjacent coastal waters, and to the increases in temperature and freshwater runoff regionally associated with global climate change.
Chesapeake Bay Watershed changes
Although many variables contribute to the trend of increasing hypoxia in coastal waters, higher inputs of nutrients from land are a major factor. Changes in the landscapes that drain into coastal waters and inadequate wastewater treatment methods have both accelerated the delivery of nutrients from the land to the sea. Natural landscapes such as forests have been cut to make room for farmlands, and farms and forests have been converted to to housing developments and cities to accommodate the growing human population (urbanization). Nutrients from farms, fertilizers, industrial waste, and human sewage eventually make their way into our coastal waters, over-loading them with nutrients. These extra nutrients cause excessive growth of algae and rapid depletion of oxygen (eutrophication). These trends are further aggravated by the loss of wetlands and other natural landscapes, which would otherwise filter nutrients from these sources.


Seasonal Trends
While large-scale changes in hypoxia are occurring over decades, many coastal systems such as Chesapeake Bay exhibit strong variations in hypoxia, which may change with year-to-year variations in climatic conditions. Spring is generally a time of rain and melting snow that causes large volumes of water to flow from rivers into northern estuaries. The river water delivers nutrients to the estuary that feed spring phytoplankton blooms. At the end of spring, phytoplankton absorb available nutrients, die, and sink to the estuarine bottom. On the bottom, they are decomposed by bacteria in a process that consumes oxygen. As the temperature warms in summer, the water can’t hold as much oxygen and the bacteria consume oxygen more rapidly, causing hypoxia in the deeper sections of the estuary.
The top figure in the animation is the distribution of algae, the middle figure shows the oxygen concentrations (with red indicating a Dead Zone) and the bottom is a conceptual diagram that shows how the algae grow, how they sink to the bottom, and how their sinking leads to the formation of dead zones in this estuary. The animation shows how algae bloom throughout the water column in the middle part of the estuary in March and April, where by mid May, the algae sink to the bottom layer where they are decomposed by bacteria to consume oxygen through June, July, and August. At this time, the Dead Zone forms in the same part of the estuary where the spring algae bloom died and sank to the bottom. By September, mixing of cooler water throughout the water column makes the Dead Zone disappear.

Global trends
Low oxygen conditions occur in marine waters in all parts of the world. Historically, hypoxia has occurred naturally in most of these systems, but, over time, the volume, area, and duration of hypoxia has increased in many marine waters. Click the links below to explore case studies from the Baltic Sea, the Black Sea, the Chesapeake Bay, and the Gulf of Mexico.